Topographic Map Legend and Symbols
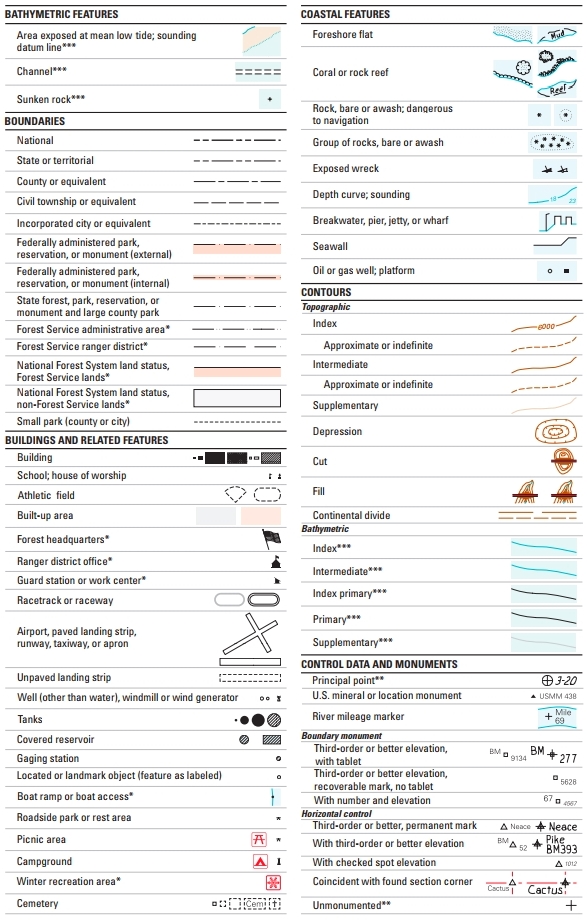
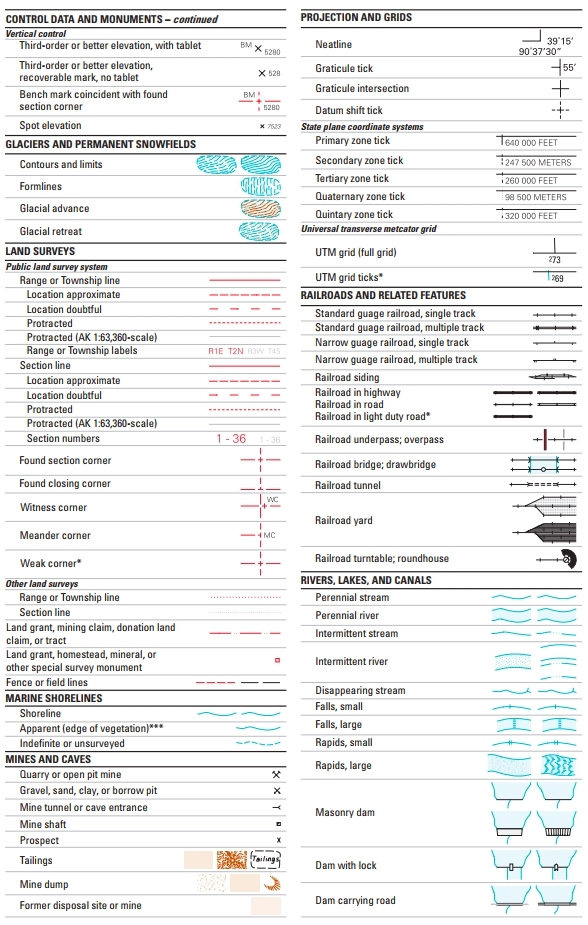
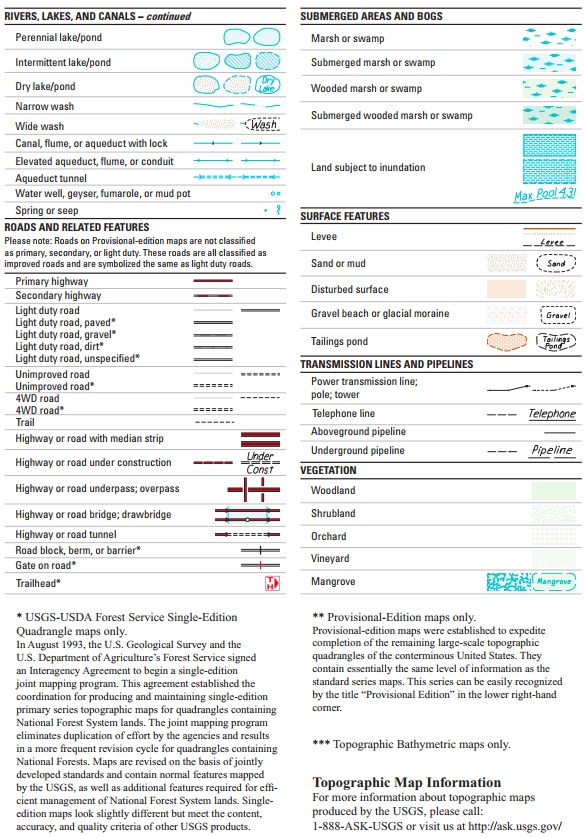
The topographic maps on the United States Geological Survey (USGS) and have evolved for more than a century. Over time the maps became more detailed and new symbols were added for the different terrain, natural features, land boundaries, and man-made structures depicted by the surveyors. This legend is now a complex document that explains the subtleties within each category of features.
In general, these are the major color categories used on USGS topo maps.
- Brown lines – contours (note that intervals vary)
- Black lines – roads, railroads, trails, and boundaries
- Red lines – survey lines (township, range, and section lines)
- Blue areas – streams and solid is for larger bodies of water
- Green areas – vegetation, typically trees or dense foliage
- Pink or light gray areas – cities and dense buildings (“built-up areas”)
- Purple areas – used to show what was new on the latest editions of their maps (USGS no longer does this but it is still on some maps)
Below is the latest version of the legend that includes symbols and colors used on USGS topo maps.
Leave a comment
Comments will be approved before showing up.
Also in News & Skills
8 CAMPING HACKS FOR COOL WEATHER CAMPING
Summer may get all the attention when it comes to camping, but what about winter?

Richard White II
Author